Benchmarks are not just critical to understanding the state of your user experience today, but they will also help you pinpoint what contributes to performance changes over time. Routine checks on various page speed metrics like total page load time, total page weight, and Speed Index for perceived performance for your major pages will enable you to see if things get slower on your site (and hopefully, why). Table 6-1 outlines the major tools you can use for benchmarking your site’s performance, many of which we’ll cover in this chapter.
| Tool | Type | Benchmark | Timing |
|---|---|---|---|
| YSlow | Browser plug-in | Overall grade, recommendations | As you develop, then once every quarter |
| Chrome DevTools | Browser plug-in | Recommendations, waterfall chart, frames per second | As you develop, then once every quarter |
| WebPagetest | Sythentic testing | Overall grade, recommendations, waterfall chart, Speed Index | Every time you make a large change or experiment |
| Catchpoint, Gomez, wpt-script, etc. | Sythentic testing (trending) | Trends in your site’s performance over time | Monthly |
| Google Analytics, mPulse, Glimpse, etc. | Real user monitoring | Median load time for various audience demographics | Weekly |
As sites age and change, there are plenty of opportunities for both improvements and degradations in performance; it’s imperative to keep an eye on these metrics using browser plug-ins, synthetic tests, and real user monitoring.
Browser Tools
To begin to see how well your site performs with basic page load time measurements (Chapter 2), test your pages with browser plug-ins as you develop. Tools like YSlow and Chrome DevTools will help you see how your site stacks up against the key principles of performance optimization.
YSlow
As mentioned in “Page Weight,” YSlow is an excellent way for you to check on your resources’ total file sizes. YSlow is a browser plug-in available for Firefox, Opera, Chrome, and Safari; via the command line; and as a bookmarklet. In addition to inspecting the file size of different resources on your page, you can use YSlow to get basic recommendations to improve your page load time (Figure 6-1).
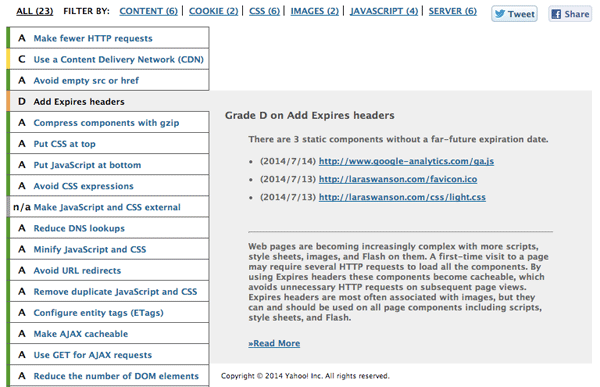
Take a look at YSlow’s recommendations for your page. In this case, I’ve selected its recommendation to add Expires headers to see which files this applies to. I can use this recommendation to spot which resources I need to add caching rules for very easily; in this case, I can ignore the part about caching the Google Analytics script, as it’s served by a third party (Google) and the caching rules are out of my hands.
YSlow will give you an overall performance score, which you can aim to improve over time (Figure 6-2). Keep track of your score and regularly check in with it as you iterate on your site’s design, content, backend, and so on, and make sure you’re staying up-to-date with performance improvements. You can compare this score and set of recommendations to PageSpeed Insights, Google’s online web performance analysis tool, as well.

Chrome DevTools
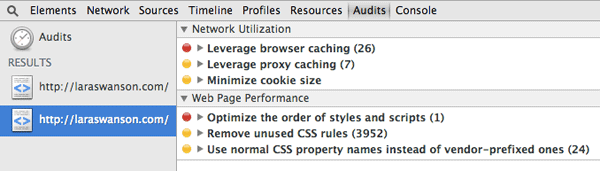
For further optimization, open Chrome DevTools and run a Web Page Performance Audit. DevTools will analyze your page and give you basic web performance improvement tips (Figure 6-3). There are some overlaps between all of the browser plug-ins mentioned here; you’ll need to take a look at the recommendations in Chrome DevTools just like in the other plug-ins to be sure the recommendations make sense for your site.
After checking out the basic recommendations that DevTools offers, inspect the Network tab (Figure 6-4). This tab shows you a timeline of resource requests on the page that occur while DevTools is open, helping you gather waterfall information as you work on your site.
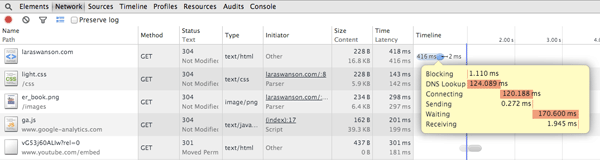
The Network tab is really handy to help you see how the critical path is affected, what resources are taking too long to load, and what kind of latency each request experiences. You can also see cookie information, sort by the duration it takes for resources to load or their latency, and filter by type of request. Poke around the Network tab to make sure that you have a healthy critical rendering path and that there aren’t any requests that are taking a tremendously long time to fully load.
We can also use Chrome DevTools to help identify jank. Turn on the FPS (frames per second) meter in DevTools using the Rendering tools window (Figure 6-5) to see which areas of a page trigger a drop in frames per second as you scroll through your site, which is an indicator of poor perceived performance.
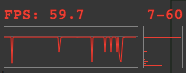
At Etsy, we found that one of our pages triggered jank when a user scrolled down the page. The team used this FPS meter to help isolate the problem area (in our case, excessive box-shadow on some elements was triggering the jank) so we could make a fix and eliminate the jank on scroll. The team found that fixing the issue had a statistically significant positive impact on engagement metrics. You should run your site through Chrome DevTool’s audit recommendations, Network tab, and Rendering tools as you develop a new design or feature, and then once every quarter thereafter.
Now that you’ve run your site through various browser plug-ins, completed implementation of their suggestions, and spot-checked the site’s timeline and frames per second, it’s time to get an even more realistic set of performance benchmarks using more browsers and locations.
Synthetic Testing
After you’ve run your site through browser plug-ins, it’s helpful to get a sense of how your site performs outside the comfort of your own browser and geographic location. Synthetic performance tools help you get a better sense of how your pages load by using a third party’s testing location and device; you can see how your site performs on various platforms across the world.
Use synthetic tests to get baseline performance metrics for your pages as you iterate and optimize your site’s design. Synthetic testing won’t necessarily represent what your users are actually experiencing when they visit your site (real user monitoring is best for this), but it’ll give you a better idea than simply testing in your own browser.
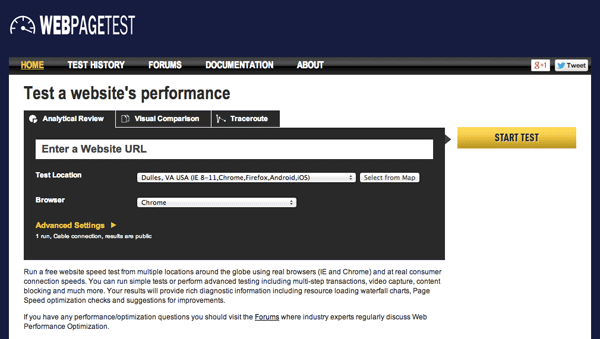
WebPagetest is a very popular, well-documented, robust synthetic testing solution for performance. You can gain plenty of insight into how your site performs by running tests using WebPagetest (Figure 6-6).
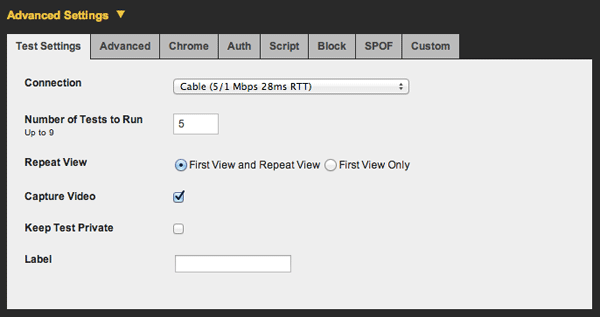
Running a test on WebPagetest with the default settings will send your page through one first view and one repeat view so you can compare differences in page load time when assets have been cached. The test defaults to a cable connection. You can also choose additional runs under the Advanced Settings (Figure 6-7). I recommend choosing five runs; WebPagetest will select the median first view and median repeat view for result analysis.
WebPagetest will save these results for up to one year, so you can compare your tests to previous results as you begin to improve your site’s page load time. If you create an account with WebPagetest, you’ll be able to see your tests separate from everyone else’s. Also, you can host a private instance of WebPagetest yourself! The added benefits of a private instance include the ability to test a development (nonlive) site, which can be great for incorporating performance into your design and development workflow. You can also automate tests using a private instance to save yourself some time.
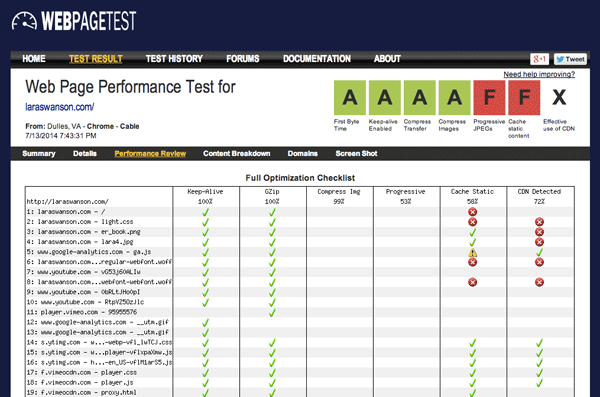
WebPagetest provides page performance recommendations, similar to PageSpeed and YSlow. Choose the Performance Review link at the top of your test to see the details of the test results (Figure 6-8) and your potential page load time savings.
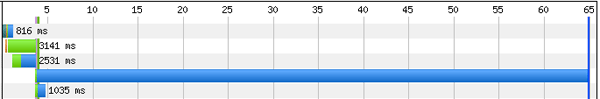
In addition to monitoring WebPagetest’s Performance Review and your scores for things like First Byte Time and Compress Images, inspect your waterfalls. When looking at a waterfall, identify requests that are taking a significantly long time to load, like in Figure 6-9. These could be flukes, which is why it’s good to run multiple tests at once and look at the median result. But they could also indicate issues with file size or content blocking.
See what you can do to create nice, short waterfalls on your page. Also look at WebPagetest’s Speed Index score. As mentioned in “Critical Rendering Path,” Speed Index is the average time at which visible parts of the page are displayed. It will help you benchmark the perceived performance of your page, since it will tell you how quickly the “above the fold” content is populated for your users.
WebPagetest creates a chart that displays visual progress over time when you compare two WebPagetest runs. In Figure 6-10, we can see that the Bing test result was more visually complete faster than Google early on, but the rest of the Google page in this test appeared more quickly thereafter.
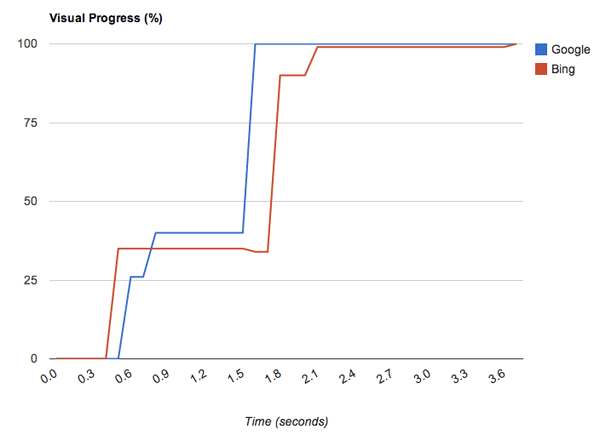
In Figure 6-10, the Google Speed Index score was 1228 and Bing’s was 1393. The smaller the Speed Index score, the better. Be sure to benchmark your own page’s Speed Index score and measure it over time as the site changes, as this is an excellent indicator of the perceived performance of your page.
Be sure to also benchmark your time to first byte, how long it takes for your page to become visually complete, and the time it takes to fully load the page using WebPagetest. Compare WebPagetests results from different browsers and locations to see how each of these metrics changes. Look for outliers in long load times or cases where the critical path may be blocked (read more in “Critical Rendering Path”).
As you iterate on a design or make performance improvements on your site, use WebPagetest to measure the before and after results. Be sure to use WebPagetests’s filmstrip view and videos for comparisons of how your page loads as you change it over time; also use WebPagetest every time you make a large change to your site or run an experiment.
Synthetic tests like WebPagetest are excellent benchmarking tools as you improve the performance of your site, and for monitoring changes to your site over time and how they impact page load time and perceived performance. Once you get comfortable with benchmarking and iterating on these performance basics, it’s time to implement real user monitoring to see what your users are truly experiencing daily on your site.
Real User Monitoring
Real user monitoring (RUM) captures web traffic to your site so you can analyze how long your pages actually take to load for your visitors. Unlike synthetic tests, which give you single data points from automated services, real user monitoring tools can give you information about the actual problems your users may experience with your site. There are plenty of real user monitoring tools out there, ranging in pricing, features, and coverage for your site. Google Analytics, mPulse, and Glimpse are all examples of real user monitoring tools you can compare to see what might work for you and your site.
After choosing a real user monitoring tool, identify your site’s major pages to see how they perform for your users over time. The home page, top landing pages, any kind of checkout flow, and other high-traffic, important areas of your site should be included in your main reports. As you look at your users’ load time for these pages, segment the data in a few different ways to get a more holistic picture of your end user experience:
- Geographic location (near/far from a datacenter, areas where your main audience lives)
- Network type (cellular, WiFi, etc.)
- Median as well as 95th percentile total page load time
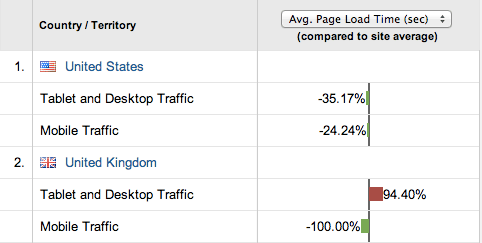
Once you have this data, begin to analyze the differences between audience groups, like in Figure 6-11. How different is the median page load time from the 95th percentile? How does the site perform for people in other countries? How about your users on mobile devices? Are there major differences in load time between your top five pages?
Isolate the reasons why these discrepancies exist and figure out what you can do to fix these performance issues. Use the results of real user monitoring tools to gain a better understanding of what your site’s user experience truly is for your entire audience, and to help you prioritize performance improvements and fixes.
After benchmarking your site’s performance using synthetic testing and real user monitoring, make as many performance improvements as you can until your site’s user experience is stable. It can be a challenge to keep site performance stable over time, however, so in the next section we’ll walk through how to continue to measure your site’s performance after these initial wins to ensure that it stays speedy.
Changes over Time
Sites age. Content gets added. Designs are iterated upon. It’s imperative that you routinely run checks on your site’s performance to look for any major changes in page weight, total load time, and perceived performance, and for any surprises that could be coming from other areas of your organization.
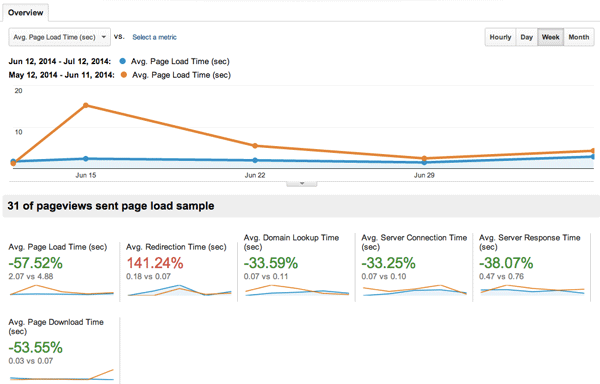
You’re likely not the only person who is working on your site. There could be other designers, developers, and content creators who are contributing new changes that affect things like load order, file sizes, scroll jank, and more. By benchmarking your site’s performance and checking in on it with some routine, you’ll be able to pinpoint any surprises in performance that arise. Did the home page suddenly double in load time thanks to a new image carousel? Was a marketing script just added to every page on the site? Did a blog post author accidentally upload images that are five times larger than they need to be? Be sure to routinely audit your major pages and find those performance surprises. In Figure 6-12, we can compare average page load time for my site’s users over time.
It’s also possible that there are no significant changes over time, but rather gradual degradations in performance. These are harder to spot and fix. On larger, more complex sites, you may start to see time to first byte increase, or page load times for the 95th percentile get slower and slower. By routinely benchmarking performance you can compare quarter to quarter, in addition to week to week, which should also help you alert others to less obvious changes in performance over time. The more aware you and the team are about performance, the more equipped you’ll be to troubleshoot and balance out normal site aging implications.
Routinely check on your images, as we walked through in “Image Planning and Iterating.” Schedule routine checks on the cleanliness of your sprites, image formats, and compression. Make sure that any new images uploaded to your site are automatically compressed and that you’re serving them at the right size. At the same time, check on the page weight for your site’s top five pages. If any of them have increased by a significant amount, isolate the reason and either fix the regression or find other places to improve performance on the page. If you have a performance budget, you can often work within this budget and find other ways to fix increases in page load time (read more in “Approach New Designs with a Performance Budget”). But all of this work depends on you regularly checking in on the performance health of your site and documenting it over time in an easily comparable way.
Some companies use an internal wiki page to manually track performance changes over time. Other companies create dashboards and alerts using data from third parties like performance monitoring tools or WebPagetest’s self-hosted option. It’s helpful to document both performance metrics as well as any reasons why performance changed; you can see which kinds of site changes have huge impacts on performance over time (redesigns, new ad or marketing scripts) and which are minor (such as small changes in content or images).
Etsy’s Q1 2014 Site Performance Report
There was a small increase in both median and 95th percentile load times over the last three months across the board, with a larger jump on the home page. we are currently running a few experiments on the home page, one of which is significantly slower than other variants, which is bringing up the 95th percentile. while we understand that this may skew test results, we want to get preliminary results from the experiment before we spend engineering effort on optimizing this variant.
This kind of log will help you educate those around you to understand how their work affects the overall end user experience. It’ll also help you go to bat when you need to defend your decision to weigh aesthetics versus performance, as we’ll discuss in Chapter 7. By benchmarking each week’s performance data and why it’s changed, you’ll empower everyone within your organization to make smart decisions in their daily design or development workflow.
One additional item to watch over time is your competitors’ page load time. If you’re able, run tests and benchmark how their sites perform over time. This can give you data about how much of a priority performance is for them, and also help you understand what aspects of the user experience they are working on over time. Spot a major performance change and investigate it: did they add new marketing tracking, incorporate a better hero image, or implement web fonts that indicate new branding? This kind of data can help you defend the importance of your own site’s performance over time to the Very Important People within your organization.
Keeping an eye on performance can be a meticulous task, so you should try to automate this data gathering and create alerts when major changes happen. Build dashboards with the data that you have and share them within your organization. If you have performance budgets or service-level agreements for a performance metric, be sure to indicate these on your graphs so you can see how much room you have or how much work there is to do. Dashboards for performance over time will be incredibly helpful for watching those slow performance degradations that are harder to spot.
Automatically alerting on performance regressions and wins will also save you a ton of time. If one of your main pages increases in week-overweek total page load time, you should be notified in a convenient way. Trigger emails or an alert that gives you the context of what the old performance benchmark was versus now, and make it easy to figure out exactly when those numbers changed. If possible, alert those individuals responsible for an area of the site if its performance changes. You can do this for wins, too; celebrate with an alert when there’s a huge improvement in performance and thank those responsible.
Over time, you will affect the page load time of your site by making both aesthetic and performance improvements. Be sure to measure all of these changes and how they impact your business metrics with A/B tests. You could be making an intentional performance improvement, or you may have a design change that will negatively impact performance; A/B tests are great for tracking all of this! Benchmarking performance as it changes over time, especially when you can directly attribute it to work being done on your site, will empower you and others to make smart decisions about aesthetics and performance. In the next chapter, we will examine how experiments are great for optimizing your overall user experience, and look at some challenges you’ll face when balancing design and performance.