As you design a site, it’s important to know the basics of page speed so you can better understand what to optimize. Browsers fetch and display content in a fairly dependable manner; understanding how web pages are rendered will help you reliably predict how your design choices will impact your site’s page speed. We’ll aim to optimize for:
- The number of resources (like images, fonts, HTML, and CSS) loaded on a page
- The file size of these resources
- The perceived performance of your site by your users
In addition to what users see as their browser renders content, there are further improvements that you can make on the backend, including optimizing any work that the server needs to do to get the first byte back to the client. There’s more that goes into page load time than just what happens on the frontend of your site, such as making calls to a database or compiling templates into HTML. However, as Steve Souders says, “80 to 90% of the end user response time is spent on the frontend.” As this is where the vast majority of the user experience lives, we’ll be focusing on the frontend aspects of page load time.
How Browsers Render Content
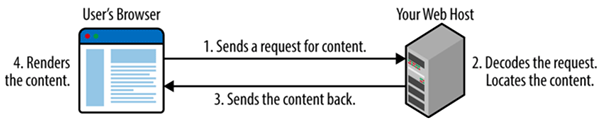
Between the moment your users enter your site’s URL into their browser and the moment the page starts to reveal your site design, their browser and your web host negotiate all the data that they need to communicate to each other.
First, the browser sends out a request to get some content. The first time the browser makes a request to a new domain, it needs to find the server where this content lives. This is called a DNS lookup. The DNS lookup figures out where on the Internet your web host lives so that the request for content can make it all the way to your server. A browser will remember this location for a set period of time (determined by the DNS settings for your server) so that it doesn’t need to spend valuable time doing this lookup for every request.
Once your server makes a connection to the user’s browser and receives its first request, it’ll decode the request and locate the content that the browser is looking for as it tries to render the page. Your server will then send back this content, whether it be an image, CSS, HTML, or another kind of asset, and the browser will begin downloading it and rendering the page for the user. Figure 2-1 illustrates this cycle.
The first byte of content that the browser receives is measured and called time to first byte (TTFB). It’s a good indicator of how quickly the backend of your site is able to process and send back content. On the frontend, once your browser begins to receive that content back from your server, it can still take some time to download and render the content on the page. Some file types are quick for browsers to process and render; other kinds of requests (like blocking JavaScript) may need to be fully processed before a user’s browser can continue to render additional content.
These content requests can vary in size and order. Browsers are smart and try to parallelize requests for content to the server in order to reduce the time it takes to render your web page. However, there are a lot of things we can do to optimize this process of requesting and retrieving your site’s content so that your site becomes interactive as quickly as possible for your users.
Requests
Optimizing the size and number of requests that it takes to create your web page will make a tremendous impact on your site’s page load time. To illustrate how requests affect total page speed, let’s look at an example waterfall chart using WebPagetest. (We will walk through how to use WebPagetest in Chapter 6.) A waterfall chart such as Figure 2-2 shows you how much time it takes to request the contents of a page, such as CSS, images, or HTML, and how much time it takes to download this content before displaying it in a browser.
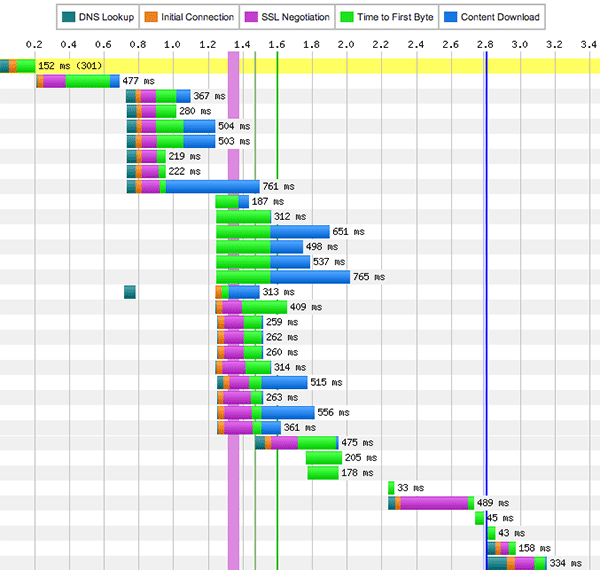
Each horizontal line in the waterfall chart represents a separate asset request, such as the HTML, a stylesheet, a script, or an image. Our first request, usually for the HTML of a page, will include a DNS lookup, as the browser needs to figure out where on the Web this content lives. Each subsequent request will then have an initial connection time to the server where the file is hosted, then some time before the first byte back is received by the user’s browser, and then additional time to download and display the content.
Naturally, the larger the piece of requested content is, the longer it will take to download, be processed by the browser, and be displayed on a page. Also, the more independent pieces of content are needed to render the page, the more time it will take for the page to fully load. This is why we will aim to optimize both the size and number of image, CSS, and JavaScript files that are required for your site to load.
For example, when we work with images, we can organize separate image requests into a single sprite (i.e., collection of images) to cut down on the number of requests that the browser needs to make (we’ll cover this technique in “Sprites”). We can also run every image through compression tools that reduce the images’ file size without compromising their quality (read more in “Additional Compression”). We’ll also focus on reducing the total number of CSS and JavaScript files, and loading them in the best order possible for perceived performance, as described in “CSS and JavaScript Loading.” Optimizing the size and number of requests that your browser needs to load your page will help you optimize your site’s speed.
Connections
The number of requests that it takes to load your page is different than the number of connections your browser makes to retrieve this content. In WebPagetest, the Connection view (Figure 2-3) shows each connection to a server and the requests that are retrieved over it.
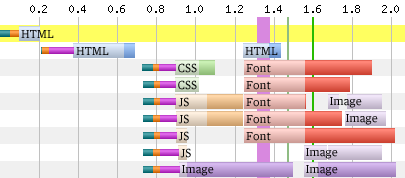
For each connection, you may see a DNS lookup for the domain (dark green), an initial connection to the server (orange), and possibly an SSL negotiation before the browser begins to retrieve the content (hot pink) for assets served over HTTPS. But browsers are smart and try to optimize downloads of content once they have that connection open to your server.
You’ll notice that in each row, there are multiple kinds of files being downloaded. This is known as a persistent connection, as the browser is able to keep a connection open and reuse it for another request. Your browser fetches some JavaScript, then uses this open connection to also grab a font file, and then an image, before needing to establish another new connection to get more content.
You’ll also notice that the browser (Chrome, in this case) has established multiple open connections at the same time, parallelizing the amount of content it can fetch. The number of simultaneous persistent connections each browser can make varies. Modern browsers allow up to six simultaneous open connections (Chrome, Firefox, Opera 12) or eight (Internet Explorer 10).
It’s important to see how many connections it takes to load your page. If you see lots of connections, then your content may be spread out over too many domains, which prevents your browser from optimizing open connections. Calling lots of third-party scripts is one way this can happen.
Use waterfall charts to assess how well your page is loading in combination with measuring your total page weight and the perceived performance of your page. Read more about WebPagetest’s waterfalls and how to find buggy content loading in Chapter 6.
Page Weight
The file size of HTML, images, and other content needed to load your page will have an effect on the total page load time. One way to measure the file size of each kind of content is to use the browser plug-in YSlow. We’ll walk through how to use it in “YSlow.”
After you run YSlow on your page, switch to the Components tab (Figure 2-4) to see a list of the content types for this page and how large they are.
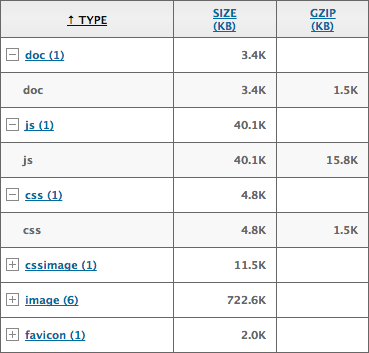
In this example, we can see that having gzip turned on decreases the size of our HTML (“doc” in this table), JavaScript, and CSS files. If you’re curious about how gzip works, we’ll cover that in “Minification and gzip.” We can also see that though there are only six images needed to load the page, they total 722.6 KB! Those are some very large images. The “cssimage” row separates any images called and applied via CSS from the images embedded directly in the site’s HTML.
Take a look at your own page weight, and compare it to the “average bytes per page” graphs at https://httparchive.org/interesting.php. Are you using a lot of CSS or JavaScript? What’s the breakdown of content types on your page—do your images vastly outweigh the other content types as in the preceding example, or is there another outlier?
There are no hard-and-fast rules about page weight; however, it’s important to keep track of your page weight over time to make sure that there are no large and surprising changes as your site evolves and more content is added or the design iterates. We’ll talk through lots more about measuring and iterating on your site’s page weight and load time in “Changes over Time.”
Look at the total page weight and the breakdown of different kinds of content in combination with the number of requests it takes to load your page and the perceived performance of your page. The amount of content needed to render your page will directly impact how long it takes to load for your users—the smaller, the better.
Perceived Performance
The perception of how fast your website loads is more important than how long it actually takes to load. Users’ perception of speed will be based on how quickly they start to see content render on the page, how quickly it becomes interactive, and how smoothly the site scrolls.
Critical Rendering Path
When your user initially loads a page, it will be blank. Blank space is a poor user experience; it makes the user feel like nothing is happening. To fix this user experience issue, you’ll need to optimize your critical rendering path.
To understand how the critical rendering path works, you need to understand how browsers craft the visual rendering of web pages by reading the HTML, CSS, and JavaScript for a page. Browsers start by creating the Document Object Model, or DOM. A browser will receive the HTML back from a web server and begin parsing it: raw bytes become characters, strings of characters become tokens like <body>, tokens become objects that have properties and rules, and finally these objects are linked together into a data structure. This last step is the creation of the DOM tree, which a user’s browser relies on for all further processing of the page.
As the browser reads through the HTML, it’ll bump into a stylesheet. The browser will pause everything and go request this file from your server. When it receives the file back, the browser will repeat a similar process: raw bytes become characters, strings of characters become tokens, tokens become objects, objects are linked in a tree structure, and we’ll finally have a CSS Object Model, or CSSOM.
Next, the user’s browser will combine the DOM and the CSSOM to create a render tree, which it’ll use to compute the size and position of every visible element. The render tree contains only what is necessary to render the page (so anything with display: none will not be included in the render tree). Lastly, the browser will display the final render tree on the screen.
This entire process captures the critical rendering path that browsers work through to display content to a user. One way to see how long it takes for a user to begin to see your site load is the “Start Render” metric in WebPagetest, which tells you how many seconds it took for the browser to begin rendering content.
With WebPagetest, we can look at the filmstrip view of a page (Figure 2-5) and see what is visible over time as it loads.

As we look at the Yahoo! home page in 0.5-second intervals, we can see that the page is blank until roughly 2 seconds into loading time. The sooner you can begin to get visible content on the page, the quicker the page will feel to your user.
There are a few ways to optimize your critical rendering path. Since, by default, CSS is treated as a render-blocking resource, use media types and media queries to indicate which parts of your CSS can be non-render-blocking:
<link href="main.css" rel="stylesheet"><link href="print.css" rel="stylesheet" media="print"><link href="big-screens.css" rel="stylesheet" media="(min-width: 61.5em)">
-
This stylesheet will apply only when the page is being printed. It will not block rendering when the page is first loaded.
-
This stylesheet will apply only when the browser’s width is equal to or greater than 61.5 em. It will not block rendering when the width of the browser is less than 61.5 em, but it will block rendering if the browser meets this
min-widthcondition.
Another way to optimize your critical rendering path is to ensure that you are loading JavaScript in the most efficient way possible. JavaScript blocks DOM construction unless it is declared as asynchronous; read more about how to make your JavaScript play nicely with the rest of page load in “CSS and JavaScript Loading.”
Want more insight into the perceived performance impact of the critical path on your site? WebPagetest will also give you a metric called “Speed Index” for your page. According to WebPagetest’s documentation, Speed Index is the average time at which visible parts of the page are displayed. It’s expressed in milliseconds and is dependent on the size of the chosen viewport.
The Speed Index metric is an excellent one to watch as you try to measure the perceived performance of your page, as it will tell you how quickly the “above the fold” content is populated for your users. It’s good to focus on how quickly your users begin to see and be able to interact with content rather than focus how long it takes for the browser to completely finish loading your page’s content (which includes any asynchronous content that is fetched and executed after the document is visually complete). You can read more about WebPagetest’s measuring of Speed Index and how long it takes to fully load a page in Chapter 6.
Time to interactivity is a term for the time between when users navigate to a page and when they can complete an action like clicking a link, performing a search, or playing a video. There are a number of ways you can improve the speed at which content begins to load and become interactive for your users by optimizing the critical rendering path:
- Asynchronously load content
- Prioritize requests for “above the fold” content
- Follow best practices for loading CSS and JavaScript (more in “CSS and JavaScript Loading”)
- Cache assets for returning users (more in “Caching Assets”)
- Ensure that any primary actions for the page are available to the user as quickly as possible
By optimizing the critical rendering path in concert with the other aspects of total page load time, you can ensure that your user has a positive impression of how quickly your site loads.
Jank
Have you ever noticed stuttering or skipping as you’re scrolling down a web page? This is referred to as jank, and it occurs when browser rendering slows down below 60 frames per second. Jank will create a poor user experience and will negatively affect your users’ perception of your site performance.
This stuttering is due to the browser’s attempt to paint a change on the page. Changing visual properties of an element (such as its background, color, border radius, or shadow) will trigger a new paint in the browser. Your user can also trigger paints by performing an action that changes the visibility of an element of your page, like showing or hiding content or clicking through a carousel. A browser will “repaint” parts of your user’s screen as things change.
Sometimes, these repaints drastically affect your browser rendering, slowing it down below the 60-frames-per-second threshold. For example, some animations (such as position, scale, rotation, and opacity) can be handled by modern browsers within 60 frames per second; other animations may create jank for your user. Repaints are expensive operations for browsers, and will make your page feel sluggish.
If you notice that your site is showing symptoms of jank, there are some browser tools available to help you debug the root cause. There is a Timeline view in Chrome DevTools (Figure 2-6) that shows you the frame rate as you interact with a page.
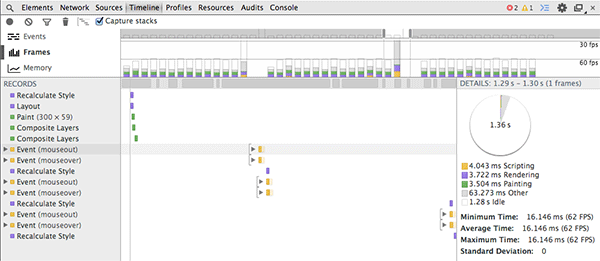
Once you click “record” and begin interacting with your page, Chrome DevTools will record the frames per second as well as what the browser was doing, such as recalculating styles, firing events, or painting. Once you find an area where the frame rate decreased below the 60-frames-per-second threshold, you can begin targeting that area to reduce repaint issues. Start by hiding elements on this area of the page to see which elements may be triggering the jank, and then play with hiding colors, shadows, and animations to see what may be the root cause of the sluggishness. Read more about how to use Chrome DevTools in “Chrome DevTools.”
When it comes to users’ perception of your site’s performance, make sure that you and others are routinely testing pages from various locations and devices. Are you able to accomplish a page’s primary task quickly, or are you finding that your site feels slow? Are you noticing sluggishness in a certain browser or mobile device? Conducting some user testing can also help you figure out which parts of your page should load the quickest, and which need further optimization to improve the perceived performance and critical rendering path.
If you find that users perceive your site as slow to load because they’re spending a long time staring at a blank page, or becoming impatient while waiting for an area to become clickable, you can focus on optimizing the load order and size of page requests. If the page becomes interactive more quickly and starts to show content faster above the fold, the perceived performance of your site improves, creating a better user experience.
Other Impacts on Page Speed
In addition to performance factors that are in your control, there are a number of environmental factors that also impact your site’s page load time, including a user’s geographic location, network, and browser.
Geography
A user’s geographic location may greatly impact the amount of time it takes to load your site. If you run multiple tests on various geographic locations using a testing tool like WebPagetest, you’ll notice a spectrum of load times. This is due to the fact that browsers are requesting and receiving data via physical connections, and there is a limit to the speed at which content can travel over long distances; it will take longer for your user’s browser to contact your server if it’s farther away. If a user is in Australia and your content lives on a server in the United States, it will take much longer for that user to access your content than it would for someone living in the United States.
This is why content delivery networks (CDNs) are used by sites that have a global user base. CDNs set up servers with copies of data around the world so that users can contact the server that is closest to them, saving time. For the Australian user base in this example, you can consider serving your content from a CDN with a location in the Asia/Pacific region so that users can access your content from a server closer to where they live.
Network
Depending upon where your users live, there may also be limitations to their bandwidth, or a cap on how much bandwidth they can consume in a given time period. The Internet infrastructure where they live might not be as stable or fast as the infrastructure that you use to test your site’s speed. Remember that as you are testing your own site, it may not be a representative user experience for your actual user base, as you may have a significantly better Internet infrastructure, a faster connection speed, and a more powerful device.
Similarly, a user’s network can have an enormous impact on how long it takes to make each request for content. On a slow network, it will take a much longer time for your user’s browser to find and then make the initial connection to your server, and then even more time to download your content. This will multiply as the number of requests your user’s browser must make to render your page increases. Mobile networks are a good example of the impact of network latency; read more about these challenges in “Mobile Networks.”
Browser
Your user’s browser may also impact the perceived performance of your site, as each browser handles requests and rendering of content slightly differently. Browsers that do not support progressive JPEGs (which we will cover in “JPEG”) will wait until a progressive JPEG file is fully downloaded before showing it on the page, which feels much slower to users than showing a baseline JPEG. Browsers that support fewer parallel connections will request and render content more slowly than newer browsers that support significantly more connections at a time.
All of these environmental factors are out of your control. However, being deliberate about optimizing your site for the quickest load time possible and routinely testing your site’s performance from various locations and devices will help you create the best user experience possible for your audience.
In the next chapter, we’ll cover the biggest chunk of most sites’ page weight: images. It’s important to keep image formatting and compression in mind, especially now that you understand how page weight and requests affect your site’s total page load time. The more you can optimize every image’s size and how it’s rendered by your user’s browser, the better your site’s user experience will be.